A rapid and low-cost fabrication method to separate particles using hydrodynamic focusing and inertial microfluidics.
Introduction
Microfluidics is impacting the field of biomedical engineering by allowing the development of complex and versatile devices for applications, such as disease diagnosis and single cell analysis. We are particularly interested in developing a modular microfluidic device for diagnosing malaria, which is a disease that still has a substantial impact on the health and economy in low- and middle-income tropical countries such as Peru. Consequently, we are looking for alternative methods for rapid and low-cost prototyping of microfluidic devices. As these devices’ traditional manufacturing process (soft lithography) requires multiple stages, complex equipment, and expensive facilities, such as a clean room, we are looking towards alternative methods, such as 3D printing as they allow for faster and cheaper fabrication of microfluidic devices. For malaria diagnosis, we need two modules to perform hydrodynamic manipulation: inertial cell separation and 3D hydrodynamic focusing. Continuous particle/cell separation is used in biological assays such as isolation of stem cells and circulating tumor cells (CTC). Our particular interest lies in the inertial separation of malaria infected red blood cells from the healthy ones. 2D and 3D hydrodynamic focusing are used in applications such as microfluidic optical flow cytometry (MOFC) and microfluidic impedance flow cytometry (MIFC) for single cell analysis, it is used to measure the electric impedance of cells by pushing them as close as possible to the microelectrodes located at the bottom of the channel. In these applications, hydrodynamic focusing is used to form a stream of single particles/cells allowing for a uniform detection of particles when flowing over optical or impedimetric sensors. Most of the reported devices have been manufactured with standard soft lithography. In our case, we aim to achieve the same precision and functionality by using an affordable 3D printer. But some low cost 3D printing methods do not have a good resolution on the micron scale such as the case of FDM technology (Fused Deposition Modeling), in which its resolution is in the range of 100 microns, in addition, due to the manufacturing method and material used, the printed objects are non-isotropic, this makes FDM technology not suitable for applications where medium and high flow rates are required such as inertial microfluidics. SLA technology (Stereolithography) is one of the best affordable 3D printing techniques available for rapid prototyping of microfluidic devices. This technology uses a UV laser to photopolymerize the photosensitive resins layer by layer in order to reproduce the 3D object designed in a CAD software. SLA-printing allows to simplify and lower the cost of fabricating devices with a resolution in the range of 25 micron, enough for applications in the cellular scale. Nowadays, commercially available 3D-SLA printers are in the price range of USD 200-2000. In this research, we present an effective method based on rapid soft lithography using a low-cost SLA 3D printer with a standard resin and simple post-processing. We compared the ideal versus manufactured dimensions of trapezoidal and rectangular cross sections of microchannels. We also show that by simple post-processing the printed molds, PDMS replicas can achieve a high bonding strength to glass. This bonding is crucial for inertial microfluidic applications as high flow rates are necessary. We tested the fabrication method by manufacturing the two components of a modular microfluidic device that will be used for our malaria diagnosis system at a later stage. We tested the focusing capacity of our devices using polystyrene microparticles ranging from 6 μm to 10 μm in size instead of blood cells. The results showed high efficacies in inertial separation and good levels of 2D-3D hydrodynamic focus that can be used for impedance measurement in our future malaria diagnostic application.
Materials and Methods
Printing of master molds: Molds were fabricated with an SLA-3D printer (Formlabs, Form2, MA, USA) with a laser-dot diameter of 140 µm and a maximum layer resolution (Z-axis) of 25 µm. CAD files were designed in AutoDesk Inventor 2020 (AutoDesk, CA, USA), exported to STL format and processed with Preform software (from Formlabs). The parameters used for printing were: layer resolution of 25 μm, Standard Clear resin-v4, no supports, molds were placed directly on the platform (Fig. 1A and Fig. S-1C), this detail is very important to reduce roughness and achieve good PDMS bonding quality. After printing and washing with IPA for 15 minutes the mold was exposed to UV light (365 nm) for 45 minutes (Fig. 1B).
Surface characterization : To find the surface roughness of the 3D printed molds, we used a roughness measuring instrument (MarSurf PS 10 Mobile, Mahr, Germany), which has a 2 μm precision and a profile resolution of 8 nm. We tested the master mold of our inertial microfluidic device and obtained a surface profile with a surface roughness of Ra =1100 nm. This result was compared with other results obtained with different fabrication processes, such as micromilling(Ra= 800nm), and with other 3D printed molds (Ra=1400nm). It indicated that our mold fabrication method is comparable to other more expensive methods and is good enough to achieve a strong bonding between PDMS replicas and glass slides.
Rapid Soft-Lithography A protocol based on rapid soft-lithography was developed with the following steps: (1) after the 3D printed master mold is fully cured, pour a premixed PDMS, with a ratio of 10:1, into the mold; (2) put the molds in a vacuum chamber and degas for 60 minutes (alternatively PDMS can be degassed for 24 hours at room temperature and pressure) (Fig. 1C, D); (3) cure the mold in the oven at 80 °C for 2 hour; (4) de-mold the PDMS device and put it back in the oven at 80 °C for 1 hour (Fig. 1E), this step is vital as it improves the bonding strength. (5) Put the PDMS device and a microscope glass slide into the plasma chamber (Tergeo-Pie Scientific, CA, USA) for bonding (Fig. 1F). (6) Finally, place the devices into the oven at 70°C for 24 hours to improve bonding (Fig. 1G, H). The manufactured devices were initially tested with stained blue water for visual inspection of the channels (Fig. 1I, J).
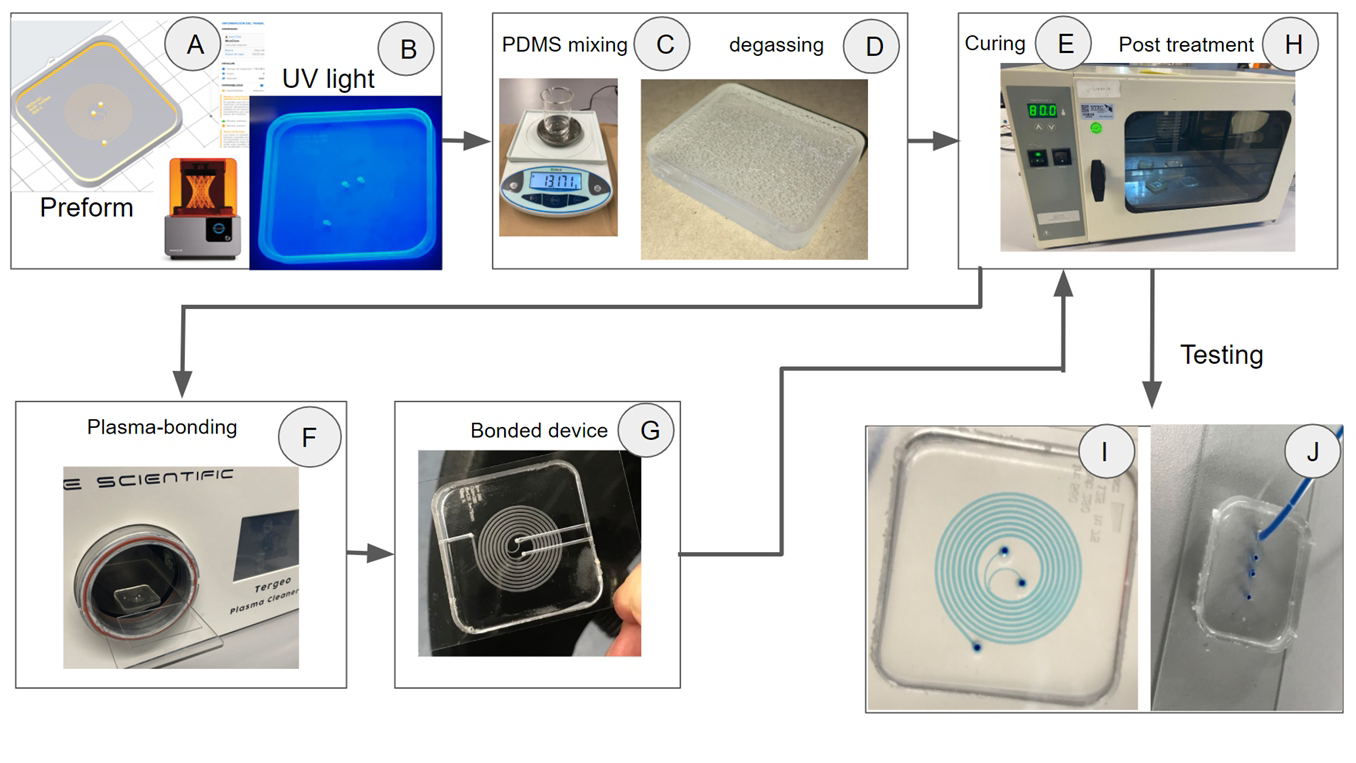
Figure 1. Fabrication and testing processes. (A). STL file processed by Preform software. (B) Post processing of the mold with UV light. (C) PDMS mixing, (D) PDMS poured into the mold for degassing, (E) PDMS curing, (F) Plasma bonding, (G) Bonded device, (H) Post treatment of the device. Devices were tested with stained blue water for visual inspection of the channels: (I) inertial separation, (J) 2D-3D hydrodynamic focusing.
Bonding quality test The bonding quality of our device was measured by injecting colored water pumped at different flow rates into the microchannels by using an Ossila Syringe pump (Ossila Ltd., UK). We systematically increased the fluid flow rate from 10 µl/s, with increments of 10 µl/s, up towe saw a water leakage, being at 80 µl/s. Inspection was done with a microscope (Zeiss, Axio Vert.A1 FL-LED, Germany). Given that the literature reports flow rates up to 50 µl/s being used for inertial separation, our results showed that our fabrication method can accommodate even the highest velocities used in inertial separation applications.
Sample preparation and imaging The microfluidic devices were tested using polystyrene beads of two different sizes, 6 µm and 10 µm. The beads were suspended 0.5% of Bovine Serum albumin (BSA) to reduce adhesion of the microbeads to the channel walls and tubing in 5 ml of distilled water so that the final concentration was 20⨯105 p/ml. The suspended particles were then passed through the microfluidic inertial sorter at three different flow rates: 16, 20, and 25 µl/s. The liquid from both the inner and outer outlets was collected and analyzed using a Neubauer chamber to obtain a count of p/ml at each outlet. The particles were processed individually to make subsequent analysis more straightforward. The hydrodynamic focusing device was tested with 10μm particles at the concentration of 20⨯105 p/ml , different flow rates were tested until getting a single particle stream wide.
Mold design and simulations
The 3D models were designed in Autodesk Inventor 2020 (Fig. 2A,B). The CAD files were imported to perform simulations in COMSOL software with a Particle Tracing for fluid flow package to evaluate the particle’s behavior along the channels.
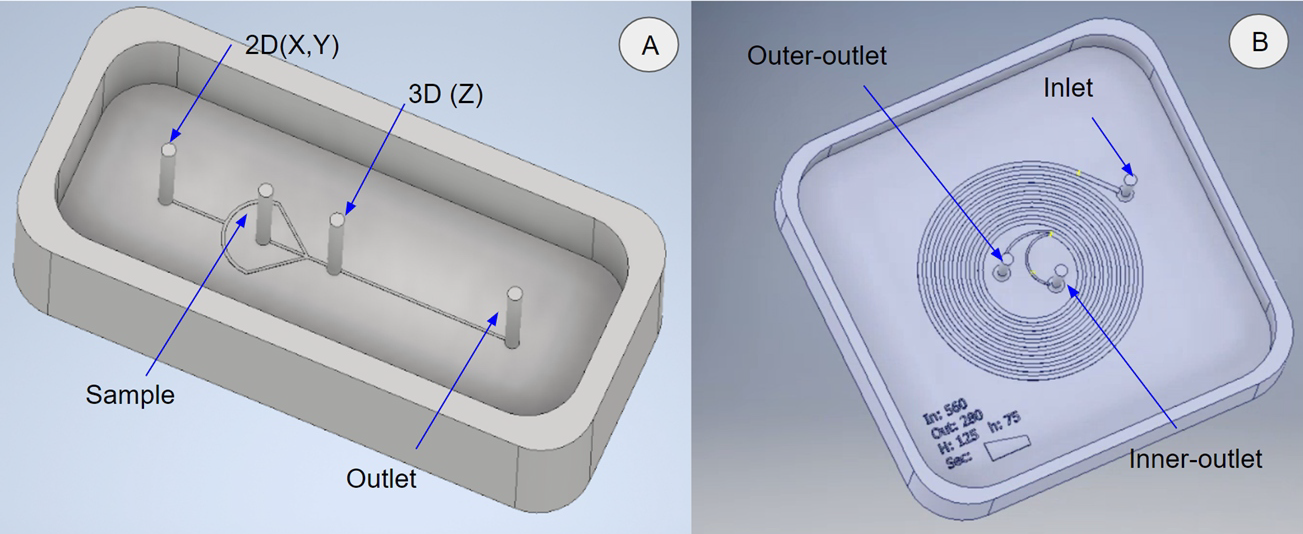
Figure 2.CAD models that were used in simulations. (A) Mold design for 2D-3D hydrodynamic focus. (B) Mold design for inertial cell/particle separation.
For the inertial separation spiral, in COMSOL Multiphysics, we simulated different configurations and obtained the optimum cross-section and inflow velocity. We used a simple unidirectional coupling with no fluid structure interaction, the model used in the simulations can be seen in Fig. 3A. In this model, we assumed a laminar Newtonian incompressible flow for a single phase. The density and dynamic viscosity were 1000 kg/m3 and 0.001 Pa.s, respectively. Moreover, we employed the P2 + P2 method that considers the second order derivative of the fluid velocity components. Also, we declared our boundary conditions as No-slip for the microchannel walls condition and the zero-pressure for outlets condition. The calculations for particle tracing were split up into two different operations. The first calculated the velocity and pressure of the fluid inside the channel using the “laminar flow” module (Fig. 3B). The second operation used the net Lift force and Dean Drag force to calculate the trajectories of particles as they moved through the channel using the “particle tracing for fluid flow” module (Fig. 3C).
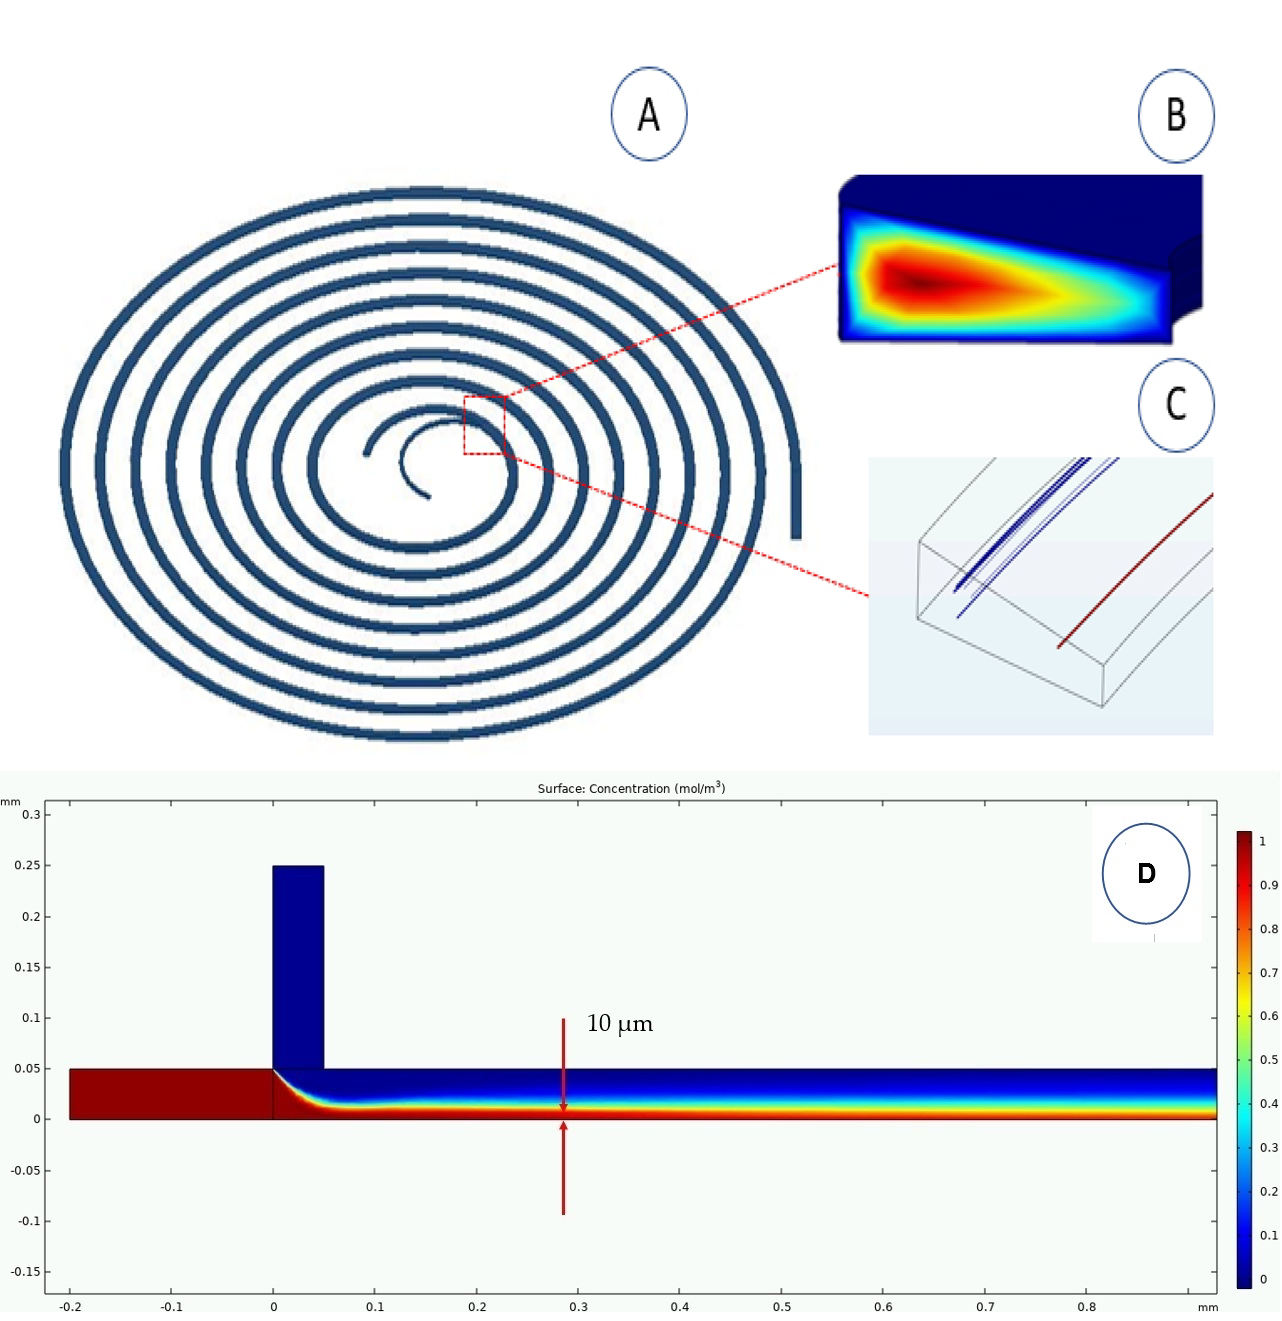
Figure 3. COMSOL simulations. (A) A spiral microchannel. (B) Laminar flow profile at the end of the spiral channel, the red and blue pattern colors indicate the highest and lowest velocities, respectively. (C) Particle separation simulation at the end of the spiral showing distribution and separation of particles of 6 μm (blues) and 10 μm (reds) within the cross section. (D) Simulation of a 3D Hydrodynamic focusing device, with a concentration of 10x6p/ml sample of 10 µm height (red tracer) for a 1 mm path in length.
The scenario was set up using the particle-tracing module depending on the physical characteristic used to separate the particles. In this scenario, rigid particles were separated according to their size; small particles (6 µm) and medium particles (10 µm). The simulation was done with two particles and then incremented up to one hundred particles. Table 3S shows the number of particles (6 µm and 10 µm) obtained in the outlets of the spiral. The sizes of these particles were chosen to represent the typical sizes of red blood cells. After we simulated different geometry configurations, we found out that the optimal dimensions for the trapezoidal geometry were 420 µm for the channel width (W), 70 µm and 130 µm for the channel heights (h, H), with an initial radius of 4 mm and a separation between spirals of 1.3 mm. The simulation results showed a tendency in which, when we increased the velocity, the biggest particles tend to go closer to the inner outlet and smallest particles tend to go closer to the outer outlet due the dominance of the drag force over the lift force (see the supplemental material). At 20µl/s and 25µl/s we found high efficacy in separating particles based on their size. In the separation process of larger diameter particles, we obtained about 80% and 90% of the particles through the inner outlet at 20µl/s and 25µl/s velocities, respectively, and in the case of smaller particles we obtained 100% of the particles through the outer outlet. These results were verified theoretically and experimentally obtaining some similarities in efficacy; as a consequence, they were taken to fabricate an optimal functional device with an efficacy comparable to other works that used expensive and sophisticated machines. For the 3D hydrodynamic focusing device (Fig. 3D), we simulated different configurations and obtained that the optimal channel height for the 3D focusing effect was within 40µm to 100µm, we used diluted species and laminar flow conditions at a steady state. Moreover, we declared our boundary conditions as No-slip for the microchannel walls condition and the zero-pressure for outlets condition. The sample (red) entered the device from the lateral inlet at a constant flow rate of 1 µl/s, this was squeezed by the 3D sheath (blue) to the bottom of the channel. By varying the 3D sheath flow rates from 1 µl/s to 3 µl/s at increments of 0.5 µl/s, we obtained a particle stream with a height of 10 µm at flow rates equal or larger than 2 µl/s (Fig. 3D). For a celular scale this height of the sample stream is enough to reduce the position-dependency related to the microelectrodes (z direction). We fabricated our device based on these results. Therefore, the simulation results matched well with what we got experimentally (see Fig. 8).
Results and Discussions
Geometry characterization: For the fabrication of the trapezoidal and rectangular cross sections, we evaluated different dimensions and compared the measured dimensions of widths and heights (Wm, Hm, hm) from the original CAD design (Wd, Hd, hd) with the aim to analyze the 3D printers accuracy and the repeatability. The results are shown in Figs. 4 and 5 that show the photomicrographs, and Table 2S shows the dimensions measured from those photographs.
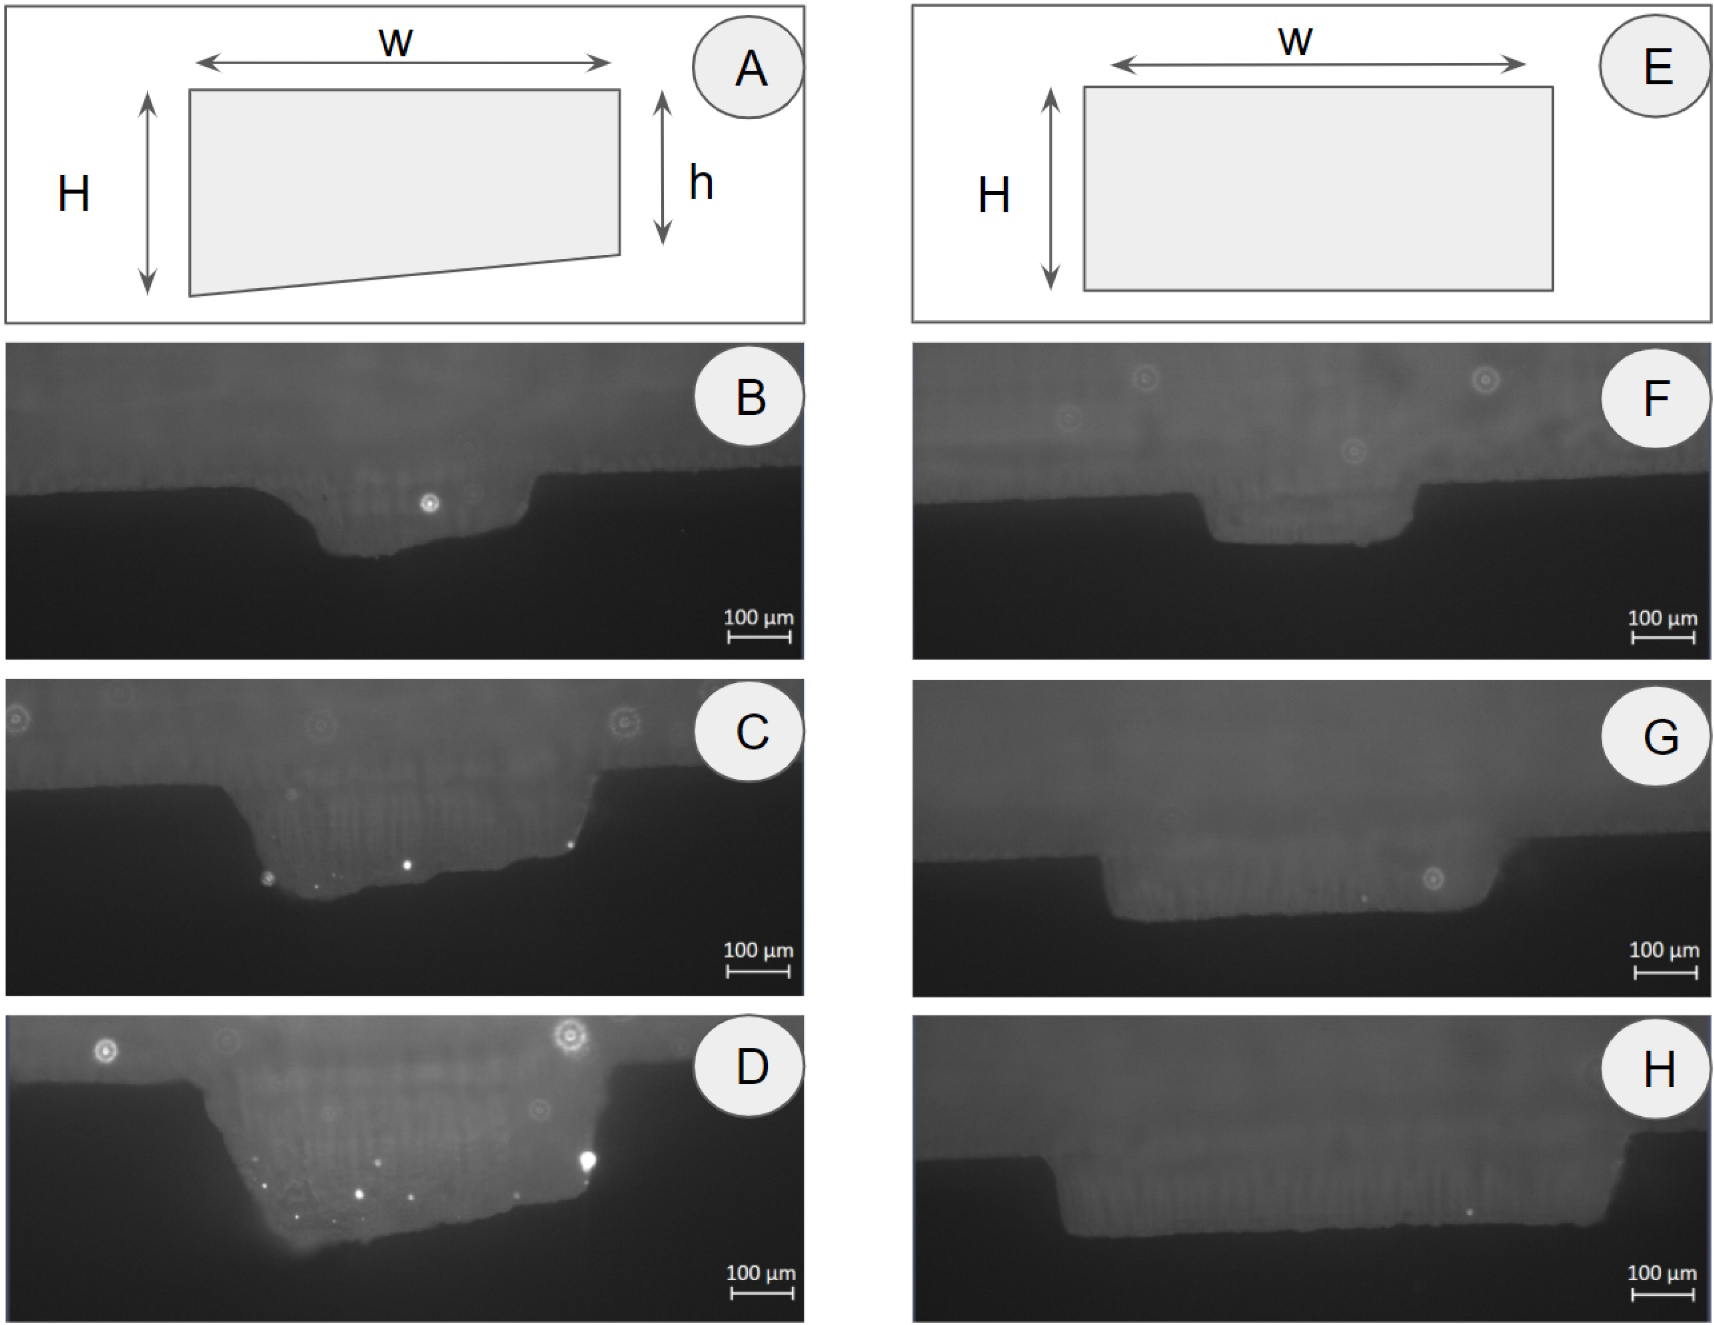
Figure 4. Geometry evaluation: CAD design (A, E); Stereomicroscopic images of manufactured trapezoidal (B, C, D) and rectangular (F, G, H) cross sections. The scale bars indicate 100 μm.
Particle separation: For inertial separation, we used a trapezoidal channel design. These are beneficial for inertial sorting , given that they increase the distance between particles with different target characteristics such as size and stiffness, avoiding different equilibrium positions (as in the case of rectangular sections) and thus making the particles/cells focus more efficiently. According previous results, to obtain the simulated cross section (420, 130, 70 µm), the dimensions of 280, 250, 125 µm (Wd, Hd, hd) were used in the CAD design in order to obtain manufactured dimensions of 435.40, 120.86, 77.71 µm (Wm, Hm, hm) for width, and heights, respectively. The microfluidic particle separation spiral was tested using polystyrene beads of two different sizes, 6 µm and 10 µm. Figure 5A shows the trajectories of the particles (6µm-red, 10 µm-green) under a fluorescent microscope.
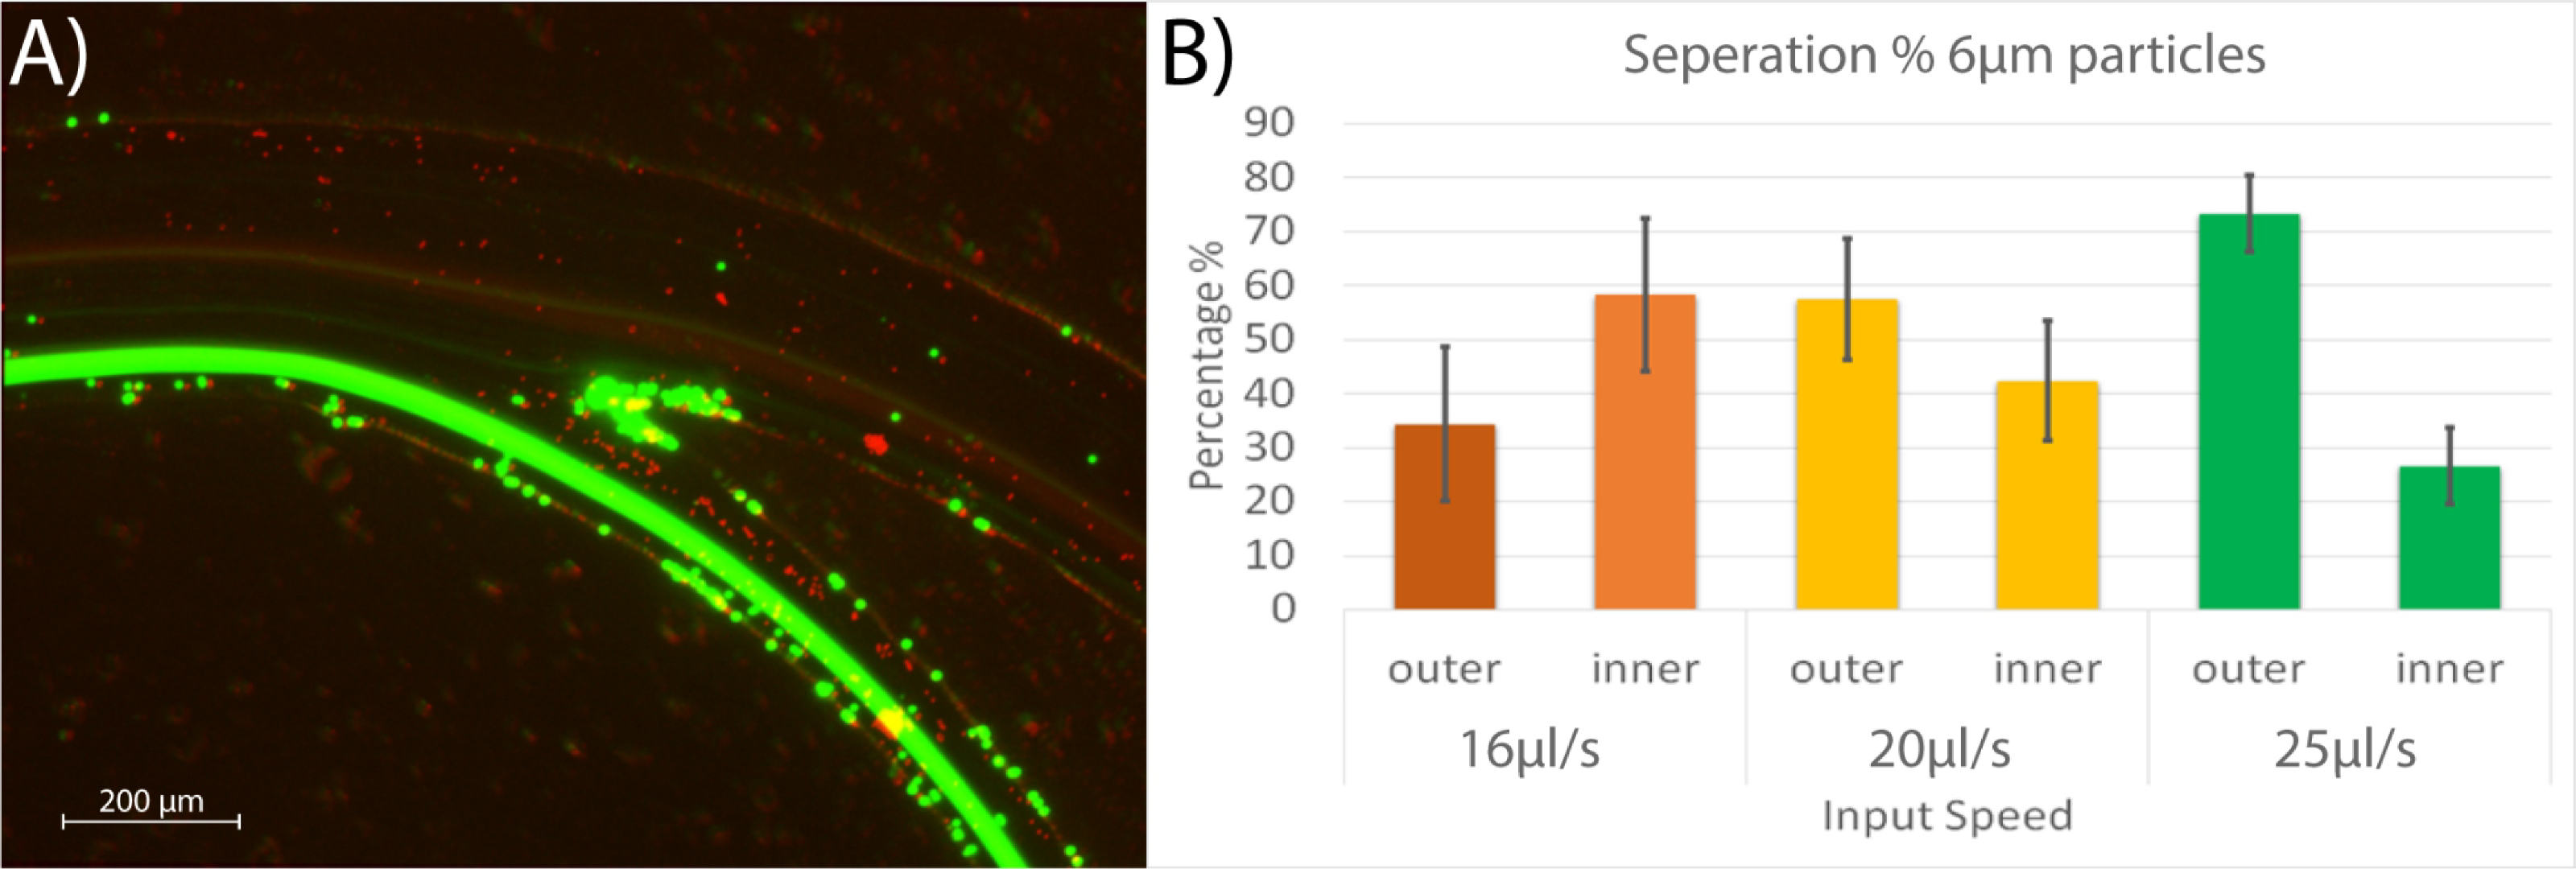
Figure 5. (A) Green particles of 10 µm in diameter were collected at the inner output (bottom) and the red particles of 6 µm at the outer output (top). (B) Separation values as a function of the input flow speed for 6 µm particles; at 25 µl/s the values are significantly different, at this speed 97% of the 10 µm particles went through the inner output.
During these experiments, we found that the larger diameter particles were strongly affected by the forces created in the fluid as they moved in the spiral channel. We obtained 96%, 98%, and 97% of the 10 µm particles through the inner output. The smaller 6 µm particles were less affected by the forces; this effect is consistent as previously reported by Vasilescu et al. where 60% of RBCs exit the spiral at the inner outlet. We obtained 36%, 58%, and 74% of the 6 µm particles through the outer outlet. These results showed that the best flow rate was at 25 µl/s. We obtained the most significant difference between particles collected at the inner and outer outlets at this velocity. Each experiment was repeated four times, and the particles were counted using a Neubauer chamber following the standard procedure for cells of diameters 6 - 10 µm (Fig. 5B). Given the average size of a RBC (6-8 µm), these results demonstrate that our device has the potential to focus red blood cells in our upcoming bio-experiments.
2D-3D hydrodynamic focusing: Rectangular cross section was used for hydrodynamic particle focusing to generate a single line of cells/particles that allows the measurement of individual particles/cells. This technique has been used to count cells and measure their electrical and physical properties. In some cases, a 2D focus (pushing the particle stream to the center of the channel in the X-Y plane) is not enough and an additional focus in 3D is required (pushing the particle stream that is already in the center of the channel in the Z-direction). In our case, 3D hydrodynamic focusing will be used in the future to measure the electric impedance of cells/particles by pushing them as close as possible to the microelectrodes located at the bottom of the microchannel [19]. The 2D-3D hydrodynamic focus system (Fig. 2A) was tested using polystyrene beads of 10 µm and distilled water for the 2D and 3D sheaths. The beads were suspended in 5 ml of distilled water so that the final concentration was 20⨯105 p/ml. Figure 7 shows a 2D focus test results. At the sample inlet, particles were passed through the microfluidic device at a constant flow rate of 1 µl/s. Then, the 2D sheath was passed through the 2D inlet (see fig. 2A) at different flow rates: 1.5 µl/s, 2 µl/s, 2.5 µl/s, and 3 µl/s in order to evaluate the lowest flow rate at which we can obtain a stream of particles of one particle diameter wide (10 µm).
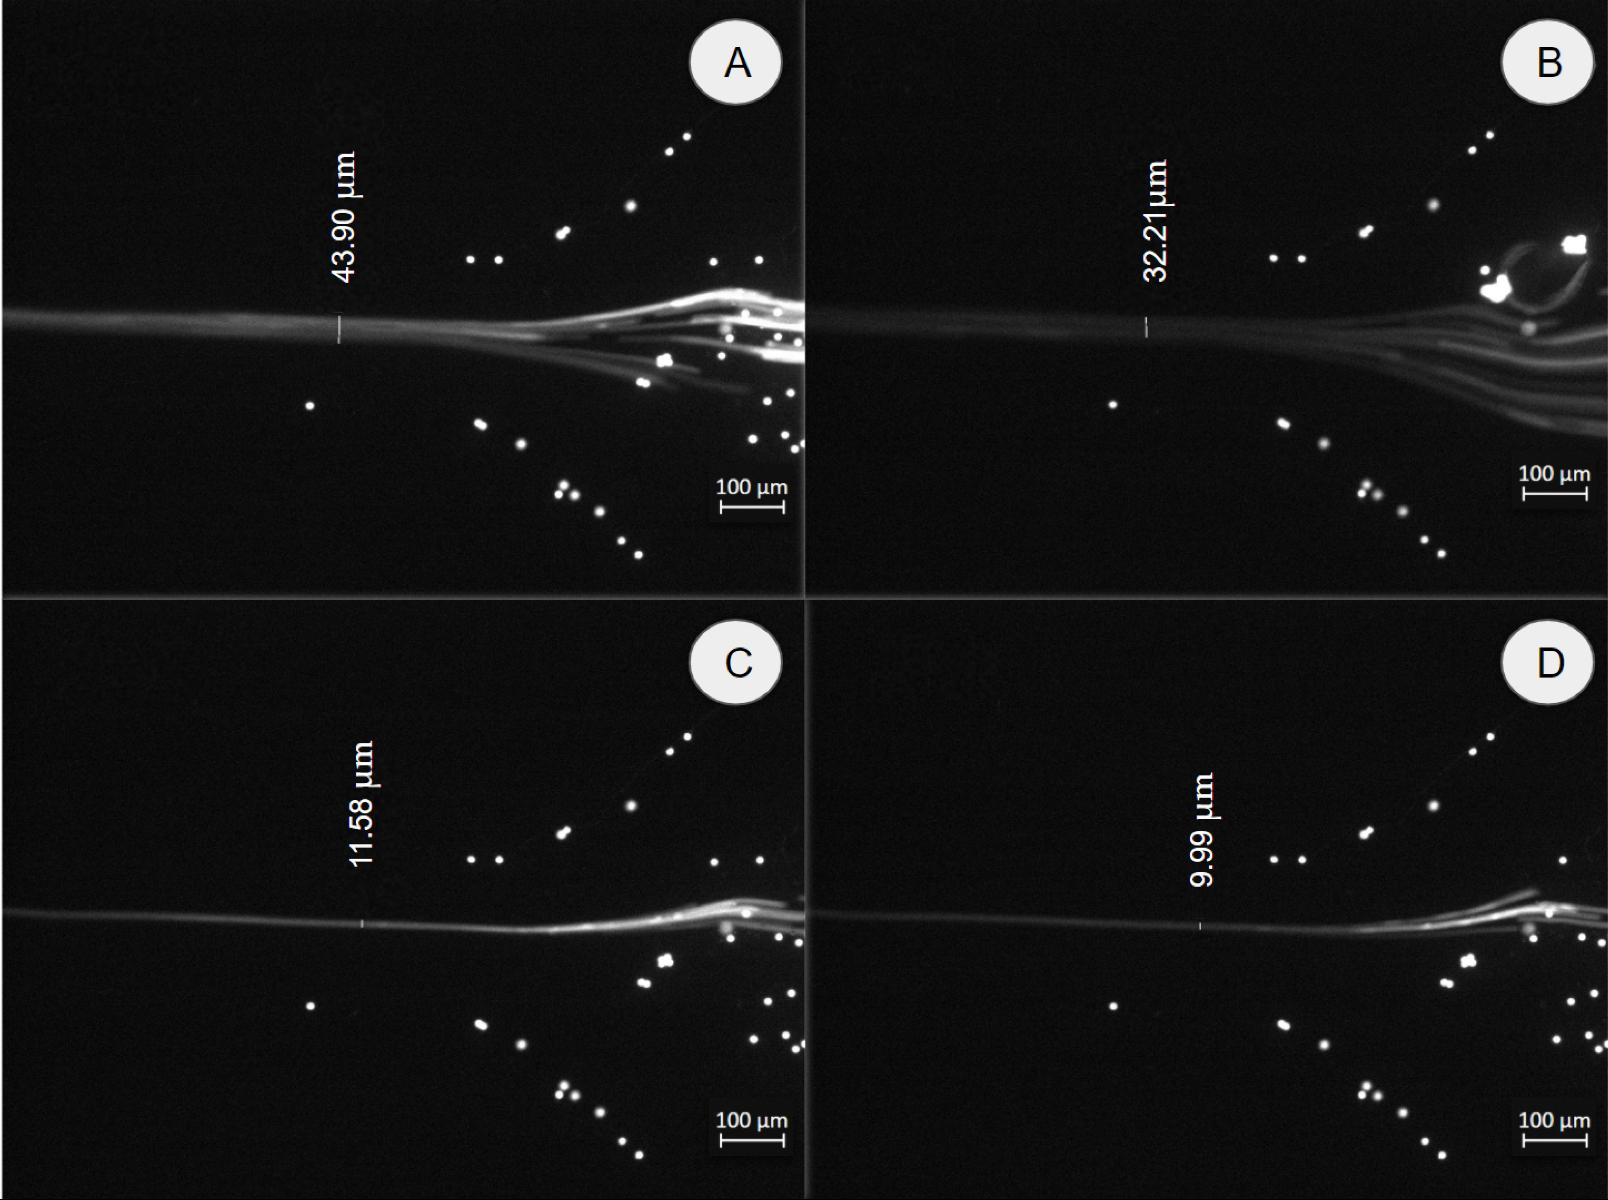
Figure 6. 2D focus test with a sample of 10 μm beads at a constant rate of 1 µl/s and different flow rates for the 2D sheath. We obtained a particle stream (white line in Figure) widths of (A) 43.9 µm at 2D sheath flow rate = 1.5 µl/s; (B) 32.2 µm at 2D sheath flow rate = 2.0 µl/s; (C) 11.6 µm at 2D sheath flow rate = 2.5 µl/s and (D) 9.99 µm at 2D sheath flow rate = 3.0 µl/s. Scale bar: 100 µm.
The results showed that at flow rates larger than 2.5 µl/s, for the 2D sheath flow, we obtained a particle stream width of 10 µm. This result demonstrated that a stream of single particles has been formed. Similar results were obtained for the smaller particles by adjusting the flow rate at the 2D inlet, this indicated that the RBCs will be well focused in the center of the channel in our future bioimpedance experiments. In this experiment, we used relatively slow flow rates (1.5 µl/s, 2 µl/s, 2.5 µl/s, and 3 µl/s); these can be increased up to 80 µl/s as reported in section 2.4. Figures 5 and 6 show particles adhered to the walls of the device, this occurs mainly due to imperfections during the printing process. In addition, the polystyrene particles are slightly hydrophobic and tend to stick to hydrophobic materials such as PDMS. As we can see, these few particles tend to stick to the sides of the channels, so they do not interfere with the focus functionality of the devices. In order to observe the 3D hydrodynamic focus (Z-direction), it was necessary to manufacture a unique mold that would allow the device to be positioned at 90 degrees on an inverted microscope. To obtain the same results as the COMSOL simulations, we used 200 µm and 150 µm (Wd, Hd) in CAD design to obtain a cross-section of 350.51 and 79.04 µm (Wm, Hm) for the width and height, respectively. Figure 8A shows the 3D hydrodynamic focusing scheme and the experimental results (Fig. 7B-E). For visualization, water with fluorescent dye was used as a sample and distilled water as 2D and 3D sheaths. We observed that the height of the sample stream became thinner as the 3D sheath flow rate increased. For this experiment, constant flow rates of 1µl/s and 2.5 µl/s were used for the sample and 2D sheath, respectively. For the 3D sheath, flow rates of 0, 1.5, 2, and 2.5 µl/s were used. We obtained sample stream heights (white line in Fig. 8 measured in the Z-direction) of 79.0, 36.7, 27.8, and 14.9 µm, respectively (Fig. 7B-E).
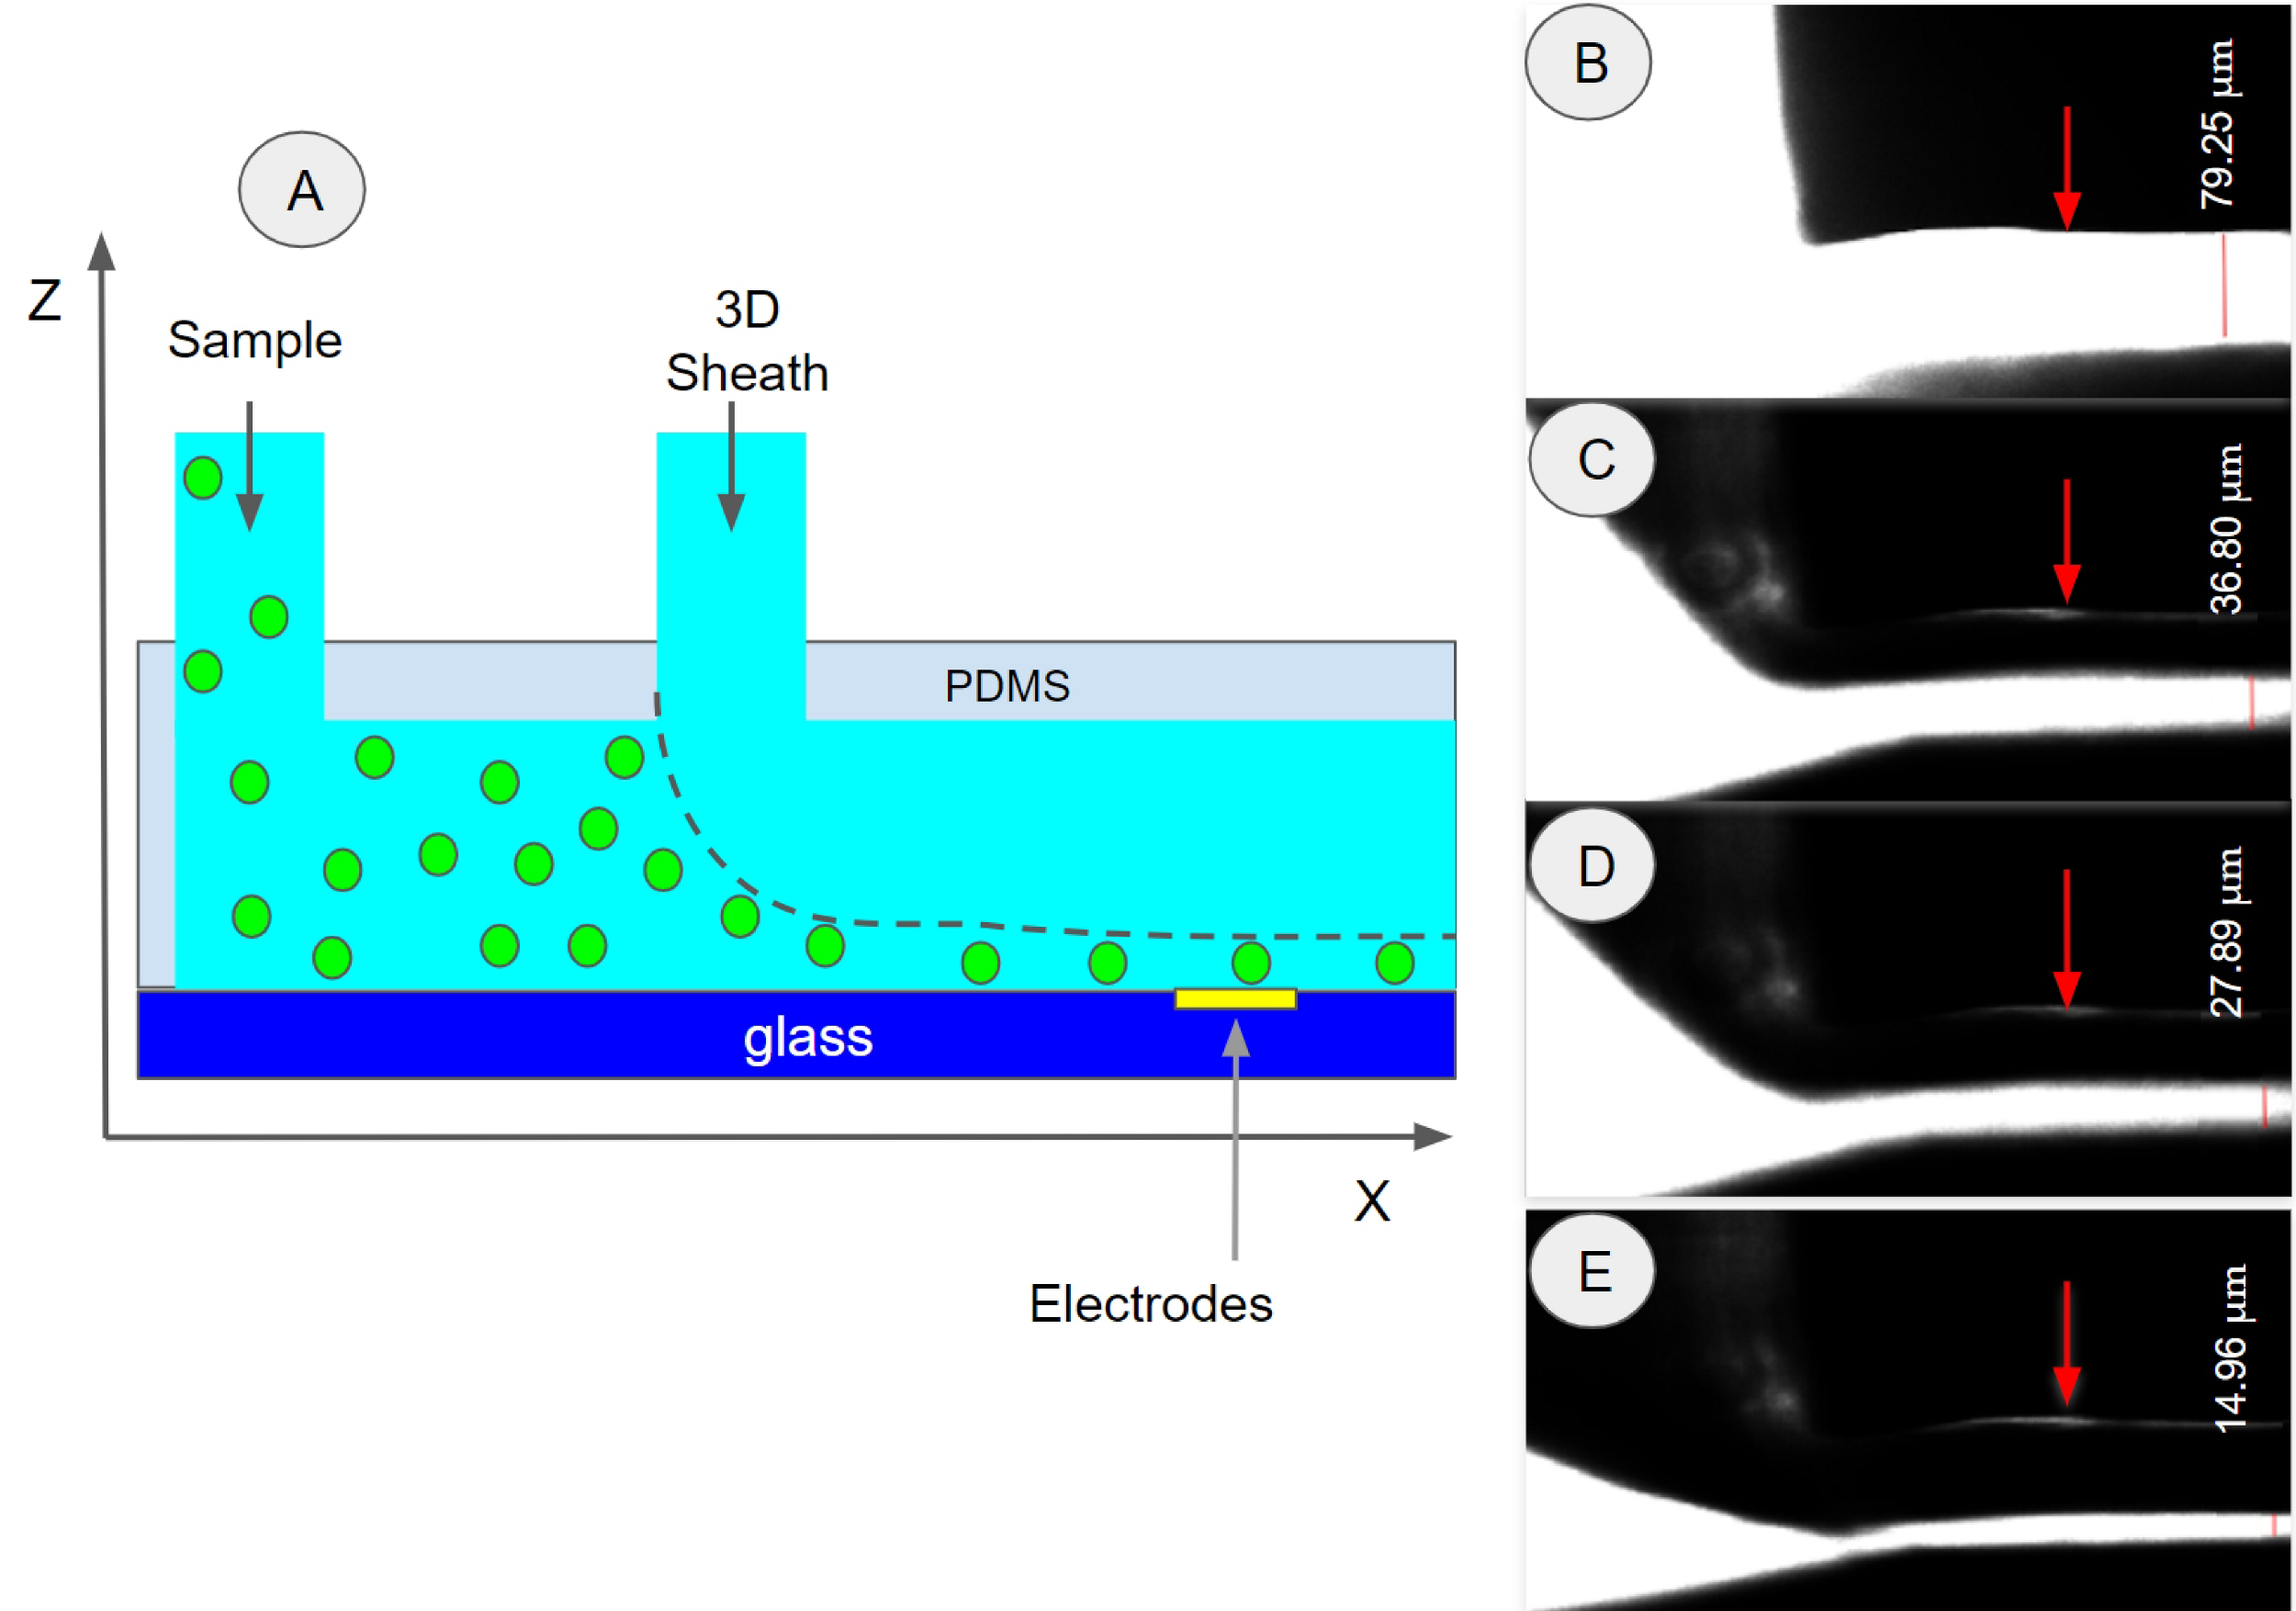
Figure 7. (A) 3D hydrodynamic focusing principle (-Z direction). (B-E) Test of the combined effect of 2D and 3D focus using a flow rate of 1 µl/s and 2.5 µl/s for sample (water with fluorescent dye) and 2D sheath (distilled water), respectively. 3D sheath (distilled water) flow rates of 0.0, 1.5, 2.0 and 2.5 µl/s were used and resulted in a sample stream (white) with a height of 79.0, 36.7, 27.8, and 14.9 µm, respectively. The red arrows indicate the top of the channel.
Conclusion
This study showed the successful fabrication of two devices, an inertial particle separator and a 2D-3D hydrodynamic focuser. The proposed manufacturing method involves the fabrication of molds using low cost standard resins, a low-cost SLA 3D printer, and simple post-processing. We evaluated the geometric fidelity for printing rectangular and trapezoidal cross-sections and found that it is possible to achieve adequate dimensions for the mentioned applications. During the development process, we observed that the surface roughness of the molds affected the bonding quality with the glass slides, despite this, with a specific printing orientation and suitable resin we obtained a high-strength plasma bonding between glass and PDMS replicas that withstood up to 80 µl/s (4.8 ml/min). This showed that PDMS castings from 3D printed molds with a roughness of 1100 nm can achieve high bonding strength and create functional microfluidic chips. In the particle separation module, we were able to obtain 97% of 10 µm particles from the inner outlet, and 73% of 6µm particles from the outer outlet at a speed of 25 µl/s. At the same time, in the hydrodynamic focusing device, we used flow rates of 1, 2.5 and 2.5 µl/s for the 2D and 3D sheath, respectively; and obtained a sample width of 10 µm for 2D focus and a sample height of 14 µm for 3D focus. These results are comparable with other research groups results who used more complex and expensive fabrication methods. We showed that the devices manufactured with our method have good performance, reproducibility, reliability, and great potential for developing biomedical devices in low-and-middle-income countries. The next step in our research is to test these devices with malaria infected blood cells for diagnosing patients’ blood samples. As a part of the project we presented two posters in different conferences, please read about them here: Poster 1 and Poster 2.
Author Contributions: Conceptualization, Luis Alvarado Murillo, Luis Flores-Olazo and Danny van Noort; Formal analysis, Luis Flores-Olazo, Luis Alvarado and Nicolas Thorne; Funding acquisition, Julio Valdivia-Silva and Danny van Noort; Methodology, Luis Flores-Olazo, Luis Alvarado and Nicolas Thorne; Project administration, Julio Valdivia-Silva; Supervision, Emir A Vela, Julio Valdivia-Silva, Julien Noel and Danny van Noort; Validation, Emir A Vela, Julien Noel and Danny van Noort; Visualization, Luis Flores-Olazo, Luis Alvarado and Nicolas Thorne; Writing – original draft, Luis Flores-Olazo, Luis Alvarado and Nicolas Thorne; Writing – review & editing, Emir A Vela, Julio Valdivia-Silva, Julien Noel and Danny van Noort. This research was funded by FONDECYT.